resistics.time module#
Classes and methods for storing and manipulating time data, including:
The TimeMetadata model for defining metadata for TimeData
The TimeData class for storing TimeData
Implementations of time data readers for numpy and ascii formatted TimeData
TimeData processors
- pydantic model resistics.time.ChanMetadata[source]#
Bases:
MetadataChannel metadata
Show JSON schema
{
   "title": "ChanMetadata",
   "description": "Channel metadata",
   "type": "object",
   "properties": {
      "name": {
         "title": "Name",
         "type": "string"
      },
      "data_files": {
         "title": "Data Files",
         "type": "array",
         "items": {
            "type": "string"
         }
      },
      "chan_type": {
         "title": "Chan Type",
         "type": "string"
      },
      "chan_source": {
         "title": "Chan Source",
         "type": "string"
      },
      "sensor": {
         "title": "Sensor",
         "default": "",
         "type": "string"
      },
      "serial": {
         "title": "Serial",
         "default": "",
         "type": "string"
      },
      "gain1": {
         "title": "Gain1",
         "default": 1,
         "type": "number"
      },
      "gain2": {
         "title": "Gain2",
         "default": 1,
         "type": "number"
      },
      "scaling": {
         "title": "Scaling",
         "default": 1,
         "type": "number"
      },
      "chopper": {
         "title": "Chopper",
         "default": false,
         "type": "boolean"
      },
      "dipole_dist": {
         "title": "Dipole Dist",
         "default": 1,
         "type": "number"
      },
      "sensor_calibration_file": {
         "title": "Sensor Calibration File",
         "default": "",
         "type": "string"
      },
      "instrument_calibration_file": {
         "title": "Instrument Calibration File",
         "default": "",
         "type": "string"
      }
   },
   "required": [
      "name"
   ]
}
- field chan_type: str | None = None#
The channel type, electric, magnetic or unknown
- Validated by:
validate_chan_type
- pydantic model resistics.time.TimeMetadata[source]#
Bases:
WriteableMetadataTime metadata
Show JSON schema
{
   "title": "TimeMetadata",
   "description": "Time metadata",
   "type": "object",
   "properties": {
      "file_info": {
         "$ref": "#/definitions/ResisticsFile"
      },
      "fs": {
         "title": "Fs",
         "type": "number"
      },
      "chans": {
         "title": "Chans",
         "type": "array",
         "items": {
            "type": "string"
         }
      },
      "n_chans": {
         "title": "N Chans",
         "type": "integer"
      },
      "n_samples": {
         "title": "N Samples",
         "type": "integer"
      },
      "first_time": {
         "title": "First Time",
         "pattern": "%Y-%m-%d %H:%M:%S.%f_%o_%q_%v",
         "examples": [
            "2021-01-01 00:00:00.000061_035156_250000_000000"
         ]
      },
      "last_time": {
         "title": "Last Time",
         "pattern": "%Y-%m-%d %H:%M:%S.%f_%o_%q_%v",
         "examples": [
            "2021-01-01 00:00:00.000061_035156_250000_000000"
         ]
      },
      "system": {
         "title": "System",
         "default": "",
         "type": "string"
      },
      "serial": {
         "title": "Serial",
         "default": "",
         "type": "string"
      },
      "wgs84_latitude": {
         "title": "Wgs84 Latitude",
         "default": -999.0,
         "type": "number"
      },
      "wgs84_longitude": {
         "title": "Wgs84 Longitude",
         "default": -999.0,
         "type": "number"
      },
      "easting": {
         "title": "Easting",
         "default": -999.0,
         "type": "number"
      },
      "northing": {
         "title": "Northing",
         "default": -999.0,
         "type": "number"
      },
      "elevation": {
         "title": "Elevation",
         "default": -999.0,
         "type": "number"
      },
      "chans_metadata": {
         "title": "Chans Metadata",
         "type": "object",
         "additionalProperties": {
            "$ref": "#/definitions/ChanMetadata"
         }
      },
      "history": {
         "title": "History",
         "default": {
            "records": []
         },
         "allOf": [
            {
               "$ref": "#/definitions/History"
            }
         ]
      }
   },
   "required": [
      "fs",
      "chans",
      "n_samples",
      "first_time",
      "last_time",
      "chans_metadata"
   ],
   "definitions": {
      "ResisticsFile": {
         "title": "ResisticsFile",
         "description": "Required information for writing out a resistics file",
         "type": "object",
         "properties": {
            "created_on_local": {
               "title": "Created On Local",
               "type": "string",
               "format": "date-time"
            },
            "created_on_utc": {
               "title": "Created On Utc",
               "type": "string",
               "format": "date-time"
            },
            "version": {
               "title": "Version",
               "type": "string"
            }
         }
      },
      "ChanMetadata": {
         "title": "ChanMetadata",
         "description": "Channel metadata",
         "type": "object",
         "properties": {
            "name": {
               "title": "Name",
               "type": "string"
            },
            "data_files": {
               "title": "Data Files",
               "type": "array",
               "items": {
                  "type": "string"
               }
            },
            "chan_type": {
               "title": "Chan Type",
               "type": "string"
            },
            "chan_source": {
               "title": "Chan Source",
               "type": "string"
            },
            "sensor": {
               "title": "Sensor",
               "default": "",
               "type": "string"
            },
            "serial": {
               "title": "Serial",
               "default": "",
               "type": "string"
            },
            "gain1": {
               "title": "Gain1",
               "default": 1,
               "type": "number"
            },
            "gain2": {
               "title": "Gain2",
               "default": 1,
               "type": "number"
            },
            "scaling": {
               "title": "Scaling",
               "default": 1,
               "type": "number"
            },
            "chopper": {
               "title": "Chopper",
               "default": false,
               "type": "boolean"
            },
            "dipole_dist": {
               "title": "Dipole Dist",
               "default": 1,
               "type": "number"
            },
            "sensor_calibration_file": {
               "title": "Sensor Calibration File",
               "default": "",
               "type": "string"
            },
            "instrument_calibration_file": {
               "title": "Instrument Calibration File",
               "default": "",
               "type": "string"
            }
         },
         "required": [
            "name"
         ]
      },
      "Record": {
         "title": "Record",
         "description": "Class to hold a record\n\nA record holds information about a process that was run. It is intended to\ntrack processes applied to data, allowing a process history to be saved\nalong with any datasets.\n\nExamples\n--------\nA simple example of creating a process record\n\n>>> from resistics.common import Record\n>>> messages = [\"message 1\", \"message 2\"]\n>>> record = Record(\n...     creator={\"name\": \"example\", \"parameter1\": 15},\n...     messages=messages,\n...     record_type=\"example\"\n... )\n>>> record.summary()\n{\n    'time_local': '...',\n    'time_utc': '...',\n    'creator': {'name': 'example', 'parameter1': 15},\n    'messages': ['message 1', 'message 2'],\n    'record_type': 'example'\n}",
         "type": "object",
         "properties": {
            "time_local": {
               "title": "Time Local",
               "type": "string",
               "format": "date-time"
            },
            "time_utc": {
               "title": "Time Utc",
               "type": "string",
               "format": "date-time"
            },
            "creator": {
               "title": "Creator",
               "type": "object"
            },
            "messages": {
               "title": "Messages",
               "type": "array",
               "items": {
                  "type": "string"
               }
            },
            "record_type": {
               "title": "Record Type",
               "type": "string"
            }
         },
         "required": [
            "creator",
            "messages",
            "record_type"
         ]
      },
      "History": {
         "title": "History",
         "description": "Class for storing processing history\n\nParameters\n----------\nrecords : List[Record], optional\n    List of records, by default []\n\nExamples\n--------\n>>> from resistics.testing import record_example1, record_example2\n>>> from resistics.common import History\n>>> record1 = record_example1()\n>>> record2 = record_example2()\n>>> history = History(records=[record1, record2])\n>>> history.summary()\n{\n    'records': [\n        {\n            'time_local': '...',\n            'time_utc': '...',\n            'creator': {\n                'name': 'example1',\n                'a': 5,\n                'b': -7.0\n            },\n            'messages': ['Message 1', 'Message 2'],\n            'record_type': 'process'\n        },\n        {\n            'time_local': '...',\n            'time_utc': '...',\n            'creator': {\n                'name': 'example2',\n                'a': 'parzen',\n                'b': -21\n            },\n            'messages': ['Message 5', 'Message 6'],\n            'record_type': 'process'\n        }\n    ]\n}",
         "type": "object",
         "properties": {
            "records": {
               "title": "Records",
               "default": [],
               "type": "array",
               "items": {
                  "$ref": "#/definitions/Record"
               }
            }
         }
      }
   }
}
- field first_time: HighResDateTime [Required]#
The datetime of the first sample
- Constraints:
pattern = %Y-%m-%d %H:%M:%S.%f_%o_%q_%v
examples = [‘2021-01-01 00:00:00.000061_035156_250000_000000’]
- field last_time: HighResDateTime [Required]#
The datetime of the last sample
- Constraints:
pattern = %Y-%m-%d %H:%M:%S.%f_%o_%q_%v
examples = [‘2021-01-01 00:00:00.000061_035156_250000_000000’]
- field chans_metadata: Dict[str, ChanMetadata] [Required]#
List of channel metadata
- property duration: attotimedelta#
Get the duration of the recording
- get_chan_types() List[str][source]#
Get all the different channel types
- Returns:
A list of different channel types
- Return type:
List[str]
Examples
>>> from resistics.testing import time_metadata_mt
>>> metadata = time_metadata_mt()
>>> metadata.get_chan_types()
['electric', 'magnetic']
- get_chans_with_type(chan_type: str) List[str][source]#
Get channels with the given type
- Parameters:
chan_type (str) – The channel type
- Returns:
A list of channels with the given channel type
- Return type:
List[str]
Examples
>>> from resistics.testing import time_metadata_mt
>>> metadata = time_metadata_mt()
>>> metadata.get_chans_with_type("magnetic")
['Hx', 'Hy']
- get_electric_chans() List[str][source]#
Get list of electric channels
- Returns:
List of electric channels
- Return type:
List[str]
Examples
>>> from resistics.testing import time_metadata_mt
>>> metadata = time_metadata_mt()
>>> metadata.get_electric_chans()
['Ex', 'Ey']
- resistics.time.get_time_metadata(time_dict: Dict[str, Any], chans_dict: Dict[str, Dict[str, Any]]) TimeMetadata[source]#
Get metadata for TimeData
The time and channel dictionaries must have the TimeMetadata required fields. For more information about the required fields, see
TimeMetadata- Parameters:
- Returns:
Metadata for TimeData
- Return type:
See also
TimeMetadataThe TimeMetadata class which is returned
Examples
>>> from resistics.time import get_time_metadata
>>> time_dict = {
...     "fs": 10,
...     "n_samples": 100,
...     "chans": ["Ex", "Hy"],
...     "n_chans": 2,
...     "first_time": "2021-01-01 00:00:00",
...     "last_time": "2021-01-01 00:01:00"
... }
>>> chans_dict = {
...     "Ex": {"name": "Ex", "data_files": "example.ascii"},
...     "Hy": {"name": "Hy", "data_files": "example2.ascii", "sensor": "MFS"}
... }
>>> metadata = get_time_metadata(time_dict, chans_dict)
>>> metadata.summary()
{
    'file_info': None,
    'fs': 10.0,
    'chans': ['Ex', 'Hy'],
    'n_chans': 2,
    'n_samples': 100,
    'first_time': '2021-01-01 00:00:00.000000_000000_000000_000000',
    'last_time': '2021-01-01 00:01:00.000000_000000_000000_000000',
    'system': '',
    'serial': '',
    'wgs84_latitude': -999.0,
    'wgs84_longitude': -999.0,
    'easting': -999.0,
    'northing': -999.0,
    'elevation': -999.0,
    'chans_metadata': {
        'Ex': {
            'name': 'Ex',
            'data_files': ['example.ascii'],
            'chan_type': 'electric',
            'chan_source': None,
            'sensor': '',
            'serial': '',
            'gain1': 1,
            'gain2': 1,
            'scaling': 1,
            'chopper': False,
            'dipole_dist': 1,
            'sensor_calibration_file': '',
            'instrument_calibration_file': ''
        },
        'Hy': {
            'name': 'Hy',
            'data_files': ['example2.ascii'],
            'chan_type': 'magnetic',
            'chan_source': None,
            'sensor': 'MFS',
            'serial': '',
            'gain1': 1,
            'gain2': 1,
            'scaling': 1,
            'chopper': False,
            'dipole_dist': 1,
            'sensor_calibration_file': '',
            'instrument_calibration_file': ''
        }
    },
    'history': {'records': []}
}
- resistics.time.adjust_time_metadata(metadata: TimeMetadata, fs: float, first_time: attodatetime, n_samples: int) TimeMetadata[source]#
Adjust time data metadata
This is required if changes have been made to the sampling frequency, the time of the first sample of the number of samples. This might occur in processes such as resampling or decimating.
Warning
The metadata passed in will be changed in place. If the original metadata should be retained, pass through a deepcopy
- Parameters:
metadata (TimeMetadata) – Metadata to adjust
fs (float) – The sampling frequency
first_time (RSDateTime) – The first time of the data
n_samples (int) – The number of samples
- Returns:
Adjusted metadata
- Return type:
Examples
>>> from resistics.sampling import to_datetime
>>> from resistics.time import adjust_time_metadata
>>> from resistics.testing import time_metadata_2chan
>>> metadata = time_metadata_2chan(fs=10, first_time="2021-01-01 00:00:00", n_samples=101)
>>> metadata.fs
10.0
>>> metadata.n_samples
101
>>> metadata.first_time
attotime.objects.attodatetime(2021, 1, 1, 0, 0, 0, 0, 0)
>>> metadata.last_time
attotime.objects.attodatetime(2021, 1, 1, 0, 0, 10, 0, 0)
>>> metadata = adjust_time_metadata(metadata, 20, to_datetime("2021-03-01 00:01:00"), 50)
>>> metadata.fs
20.0
>>> metadata.n_samples
50
>>> metadata.first_time
attotime.objects.attodatetime(2021, 3, 1, 0, 1, 0, 0, 0)
>>> metadata.last_time
attotime.objects.attodatetime(2021, 3, 1, 0, 1, 2, 450000, 0)
- class resistics.time.TimeData(metadata: TimeMetadata, data: ndarray)[source]#
Bases:
ResisticsDataClass for holding time data
The data values are stored in an numpy array attribute named data. This has shape:
n_chans x n_samples
- Parameters:
metadata (TimeMetadata) – Metadata for the TimeData
data (np.ndarray) – Numpy array of the data
Examples
>>> import numpy as np
>>> from resistics.testing import time_metadata_2chan
>>> from resistics.time import TimeData
>>> data = [[1, 2, 3, 4, 5, 6, 7, 8, 9, 10, 11], [11, 10, 9, 8, 7, 6, 5, 4, 3, 2, 1]]
>>> time_data = TimeData(time_metadata_2chan(), np.array(data))
>>> time_data.metadata.chans
['chan1', 'chan2']
>>> time_data.get_chan("chan1")
array([ 1,  2,  3,  4,  5,  6,  7,  8,  9, 10, 11])
>>> time_data["chan1"]
array([ 1,  2,  3,  4,  5,  6,  7,  8,  9, 10, 11])
- get_chan(chan: str) ndarray[source]#
Get the time data for a channel
- Parameters:
chan (str) – The channel for which to get the time data
- Returns:
pandas Series with channel data and datetime index
- Return type:
np.ndarray
- set_chan(chan: str, chan_data: ndarray) None[source]#
Set channel time data
- Parameters:
chan (str) – The channel to set the data for
chan_data (np.ndarray) – The new channel data
- Raises:
ValueError – If the data has incorrect size
ValueError – If the data has incorrect dtype
- get_timestamps(samples: ndarray | None = None, estimate: bool = True) ndarray | DatetimeIndex[source]#
Get an array of timestamps
- Parameters:
samples (Optional[np.ndarray], optional) – If provided, timestamps are only returned for the specified samples, by default None
estimate (bool, optional) – Flag for using estimates instead of high precision datetimes, by default True
- Returns:
The return dates. This will be a numpy array of RSDateTime objects if estimate is False, else it will be a pandas DatetimeIndex
- Return type:
Union[np.ndarray, pd.DatetimeIndex]
- subsection(from_time: str | Timestamp | datetime, to_time: str | Timestamp | datetime) TimeData[source]#
Get a subsection of the TimeData
Returns a new TimeData object
- Parameters:
from_time (DateTimeLike) – Start of subsection
to_time (DateTimeLike) – End of subsection
- Returns:
Subsection as new TimeData
- Return type:
- subsamples(from_sample: int | None = None, to_sample: int | None = None) TimeData[source]#
Get a subsample range of the TimeData
Returns a new TimeData object
- Parameters:
- Returns:
The subsamples as a new TimeData object
- Return type:
- plot(fig: Figure | None = None, chans: List[str] | None = None, color: str = 'blue', legend: str = 'TimeData', max_pts: int | None = 10000) Figure[source]#
Plot time series data
- Parameters:
fig (Optional[go.Figure], optional) – A figure if appending the data to an existing plot, by default None
chans (Optional[List[str]], optional) – Explicit definition of channels to plot, by default None
color (str, optional) – The color for the data, by default “blue”
legend (str, optional) – The legend group to use, by default “TimeData”. This is more useful when plotting multiple TimeData
max_pts (Optional[int], optional) – The maximum number of points for any channel plot before applying lttbc downsampling, by default 10_000. If set to None, no downsampling will be applied.
- Returns:
Plotly Figure
- Return type:
go.Figure
- Raises:
ValueError – If a figure is provided and channels have not been explicitly defined
- pydantic model resistics.time.TimeReader[source]#
Bases:
ResisticsProcessShow JSON schema
{
   "title": "TimeReader",
   "description": "Base class for resistics processes\n\nResistics processes perform operations on data (including read and write\noperations). Each time a ResisticsProcess child class is run, it should add\na process record to the dataset",
   "type": "object",
   "properties": {
      "name": {
         "title": "Name",
         "type": "string"
      },
      "apply_scalings": {
         "title": "Apply Scalings",
         "default": true,
         "type": "boolean"
      },
      "extension": {
         "title": "Extension",
         "type": "string"
      }
   }
}
- run(dir_path: Path, metadata_only: bool | None = False, metadata: TimeMetadata | None = None, from_time: str | Timestamp | datetime | None = None, to_time: str | Timestamp | datetime | None = None, from_sample: int | None = None, to_sample: int | None = None) TimeMetadata | TimeData[source]#
Read time series data
- Parameters:
dir_path (Path) – The directory path
metadata_only (Optional[bool], optional) – Read only the metadata, by default False
metadata (Optional[TimeMetadata], optional) – Pass the metadata if its already been read in, by default None.
from_time (Union[DateTimeLike, None], optional) – Timestamp to read from, by default None
to_time (Union[DateTimeLike, None], optional) – Timestamp to read to, by default None
from_sample (Union[int, None], optional) – Sample to read from, by default None
to_sample (Union[int, None], optional) – Sample to read to, by default None
- Returns:
A TimeData instance
- Return type:
- read_metadata(dir_path: Path) TimeMetadata[source]#
Read time series data metadata
- Parameters:
dir_path (Path) – The directory path of the time series data
- Raises:
NotImplementedError – To be implemented in child classes
- read_data(dir_path: Path, metadata: TimeMetadata, read_from: int, read_to: int) TimeData[source]#
Read raw data with minimal scalings applied
- Parameters:
dir_path (path) – The directory path to read from
metadata (TimeMetadata) – Time series data metadata
read_from (int) – Sample to read data from
read_to (int) – Sample to read data to
- Raises:
NotImplementedError – To be implemented in child TimeReader classes
- scale_data(time_data: TimeData) TimeData[source]#
Scale data to physically meaningful units.
For magnetotelluric data, this is assumed to be mV/km for electric channels, mV for magnetic channels (or nT for certain sensors)
The base class assumes the data is already in the correct units and requires no scaling.
- pydantic model resistics.time.TimeReaderJSON[source]#
Bases:
TimeReaderBase class for TimeReaders that use a resistics JSON header
Show JSON schema
{
   "title": "TimeReaderJSON",
   "description": "Base class for TimeReaders that use a resistics JSON header",
   "type": "object",
   "properties": {
      "name": {
         "title": "Name",
         "type": "string"
      },
      "apply_scalings": {
         "title": "Apply Scalings",
         "default": true,
         "type": "boolean"
      },
      "extension": {
         "title": "Extension",
         "type": "string"
      }
   }
}
- read_metadata(dir_path: Path) TimeMetadata[source]#
Read the time series data metadata and return
- Parameters:
dir_path (Path) – Path to time series data directory
- Returns:
Metadata for time series data
- Return type:
- Raises:
MetadataReadError – If the headers cannot be parsed
TimeDataReadError – If the data files do not match the expected extension
- pydantic model resistics.time.TimeReaderAscii[source]#
Bases:
TimeReaderJSONClass for reading Ascii data
Ascii data expected to be a single file with all the data. The delimiter can be set using the delimiter class attribute as can the number of header lines with the n_header attribute.
Show JSON schema
{
   "title": "TimeReaderAscii",
   "description": "Class for reading Ascii data\n\nAscii data expected to be a single file with all the data. The delimiter can\nbe set using the delimiter class attribute as can the number of header\nlines with the n_header attribute.",
   "type": "object",
   "properties": {
      "name": {
         "title": "Name",
         "type": "string"
      },
      "apply_scalings": {
         "title": "Apply Scalings",
         "default": true,
         "type": "boolean"
      },
      "extension": {
         "title": "Extension",
         "default": ".txt",
         "type": "string"
      },
      "delimiter": {
         "title": "Delimiter",
         "type": "string"
      },
      "n_header": {
         "title": "N Header",
         "default": 0,
         "type": "integer"
      }
   }
}
- read_data(dir_path: Path, metadata: TimeMetadata, read_from: int, read_to: int) TimeData[source]#
Read data from Ascii files
- Parameters:
dir_path (path) – The directory path to read from
metadata (TimeMetadata) – Time series data metadata
read_from (int) – Sample to read data from
read_to (int) – Sample to read data to
- Returns:
TimeData
- Return type:
- Raises:
ValueError – If metadata is None
- pydantic model resistics.time.TimeReaderNumpy[source]#
Bases:
TimeReaderJSONClass for reading Numpy data
This is expected to be a single data file for all channels. The ordering is assumed to be the same as the channels definition in the metadata.
Show JSON schema
{
   "title": "TimeReaderNumpy",
   "description": "Class for reading Numpy data\n\nThis is expected to be a single data file for all channels. The ordering is\nassumed to be the same as the channels definition in the metadata.",
   "type": "object",
   "properties": {
      "name": {
         "title": "Name",
         "type": "string"
      },
      "apply_scalings": {
         "title": "Apply Scalings",
         "default": true,
         "type": "boolean"
      },
      "extension": {
         "title": "Extension",
         "default": ".npy",
         "type": "string"
      }
   }
}
- read_data(dir_path: Path, metadata: TimeMetadata, read_from: int, read_to: int) TimeData[source]#
Read raw data saved in numpy data
- Parameters:
dir_path (path) – The directory path to read from
metadata (TimeMetadata) – Time series data metadata
read_from (int) – Sample to read data from
read_to (int) – Sample to read data to
- Returns:
TimeData
- Return type:
- Raises:
ValueError – If metadata is None
- pydantic model resistics.time.TimeWriterNumpy[source]#
Bases:
ResisticsWriterWrite out time data in numpy binary format
Data is written out as a single data file including all channels
Show JSON schema
{
   "title": "TimeWriterNumpy",
   "description": "Write out time data in numpy binary format\n\nData is written out as a single data file including all channels",
   "type": "object",
   "properties": {
      "name": {
         "title": "Name",
         "type": "string"
      },
      "overwrite": {
         "title": "Overwrite",
         "default": true,
         "type": "boolean"
      }
   }
}
- pydantic model resistics.time.TimeWriterAscii[source]#
Bases:
ResisticsWriterWrite out time data in ascii format
Show JSON schema
{
   "title": "TimeWriterAscii",
   "description": "Write out time data in ascii format",
   "type": "object",
   "properties": {
      "name": {
         "title": "Name",
         "type": "string"
      },
      "overwrite": {
         "title": "Overwrite",
         "default": true,
         "type": "boolean"
      }
   }
}
- resistics.time.new_time_data(time_data: TimeData, metadata: TimeMetadata | None = None, data: ndarray | None = None, record: Record | None = None) TimeData[source]#
Get a new TimeData
Values are taken from an existing TimeData where they are not explicitly specified. This is useful in a process where only some aspects of the TimeData have been changed
- Parameters:
time_data (TimeData) – The existing TimeData
metadata (Optional[TimeMetadata], optional) – A new TimeMetadata, by default None
data (Optional[np.ndarray], optional) – New data, by default None
record (Optional[Record], optional) – A new record to add, by default None
- Returns:
A new TimeData instance
- Return type:
- pydantic model resistics.time.TimeProcess[source]#
Bases:
ResisticsProcessParent class for processing time data
Show JSON schema
{
   "title": "TimeProcess",
   "description": "Parent class for processing time data",
   "type": "object",
   "properties": {
      "name": {
         "title": "Name",
         "type": "string"
      }
   }
}
- pydantic model resistics.time.Subsection[source]#
Bases:
TimeProcessGet a subsection of time data
- Parameters:
from_time (DateTimeLike) – Time to take subsection from
to_time (DateTimeLike) – Time to take subsection to
Examples
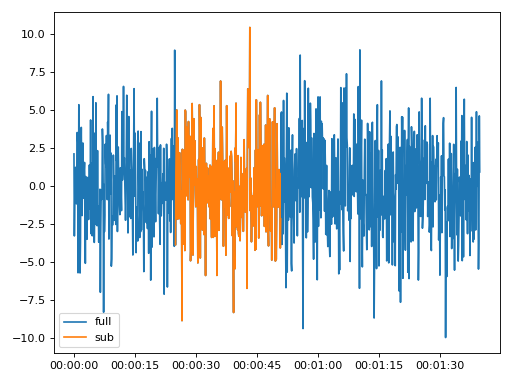
>>> import matplotlib.pyplot as plt
>>> from resistics.testing import time_data_random
>>> from resistics.time import Subsection
>>> time_data = time_data_random(n_samples=1000)
>>> print(time_data.metadata.first_time, time_data.metadata.last_time)
2020-01-01 00:00:00 2020-01-01 00:01:39.9
>>> process = Subsection(from_time="2020-01-01 00:00:25", to_time="2020-01-01 00:00:50.9")
>>> subsection = process.run(time_data)
>>> print(subsection.metadata.first_time, subsection.metadata.last_time)
2020-01-01 00:00:25 2020-01-01 00:00:50.9
>>> subsection.metadata.n_samples
260
>>> plt.plot(time_data.get_timestamps(), time_data["Ex"], label="full")
>>> plt.plot(subsection.get_timestamps(), subsection["Ex"], label="sub")
>>> plt.legend(loc=3)
>>> plt.tight_layout()
>>> plt.show()
(
Source code,png,hires.png,pdf)
See also
SubsamplesGetting a section of data using samples rather than dates
Show JSON schema
{
   "title": "Subsection",
   "description": "Get a subsection of time data\n\nParameters\n----------\nfrom_time : DateTimeLike\n    Time to take subsection from\nto_time : DateTimeLike\n    Time to take subsection to\n\nExamples\n--------\n.. plot::\n    :width: 90%\n\n    >>> import matplotlib.pyplot as plt\n    >>> from resistics.testing import time_data_random\n    >>> from resistics.time import Subsection\n    >>> time_data = time_data_random(n_samples=1000)\n    >>> print(time_data.metadata.first_time, time_data.metadata.last_time)\n    2020-01-01 00:00:00 2020-01-01 00:01:39.9\n    >>> process = Subsection(from_time=\"2020-01-01 00:00:25\", to_time=\"2020-01-01 00:00:50.9\")\n    >>> subsection = process.run(time_data)\n    >>> print(subsection.metadata.first_time, subsection.metadata.last_time)\n    2020-01-01 00:00:25 2020-01-01 00:00:50.9\n    >>> subsection.metadata.n_samples\n    260\n    >>> plt.plot(time_data.get_timestamps(), time_data[\"Ex\"], label=\"full\") # doctest: +SKIP\n    >>> plt.plot(subsection.get_timestamps(), subsection[\"Ex\"], label=\"sub\") # doctest: +SKIP\n    >>> plt.legend(loc=3) # doctest: +SKIP\n    >>> plt.tight_layout() # doctest: +SKIP\n    >>> plt.show() # doctest: +SKIP\n\nSee Also\n--------\nSubsamples : Getting a section of data using samples rather than dates",
   "type": "object",
   "properties": {
      "name": {
         "title": "Name",
         "type": "string"
      },
      "from_time": {
         "title": "From Time",
         "anyOf": [
            {
               "type": "string"
            },
            {
               "type": "string",
               "format": "date-time"
            },
            {
               "type": "string",
               "format": "date-time"
            }
         ]
      },
      "to_time": {
         "title": "To Time",
         "anyOf": [
            {
               "type": "string"
            },
            {
               "type": "string",
               "format": "date-time"
            },
            {
               "type": "string",
               "format": "date-time"
            }
         ]
      }
   },
   "required": [
      "from_time",
      "to_time"
   ]
}
- pydantic model resistics.time.Subsamples[source]#
Bases:
TimeProcessGet a subsamples of time data, an alternative to getting a subsection by times
- Parameters:
from_sample (int) – Sample to begin from
to_time (DateTimeLike) – Sample to end at
Examples
Taking subsample using positive sample numbers. Sample 0 is the first sample and sample -1 is the last sample.
>>> import matplotlib.pyplot as plt
>>> from resistics.testing import time_data_random
>>> from resistics.time import Subsamples
>>> time_data = time_data_random(n_samples=300)
>>> print(time_data.metadata.first_time, time_data.metadata.last_time)
2020-01-01 00:00:00 2020-01-01 00:00:29.9
>>> process = Subsamples(from_sample=10, to_sample=120)
>>> subsample = process.run(time_data)
>>> print(subsample.metadata.first_time, subsample.metadata.last_time)
2020-01-01 00:00:01 2020-01-01 00:00:12
>>> subsample.metadata.n_samples
111
>>> plt.plot(time_data.get_timestamps(), time_data["Ex"], label="full")
>>> plt.plot(subsample.get_timestamps(), subsample["Ex"], label="sub")
>>> plt.legend(loc=3)
>>> plt.tight_layout()
>>> plt.show()
(
Source code,png,hires.png,pdf)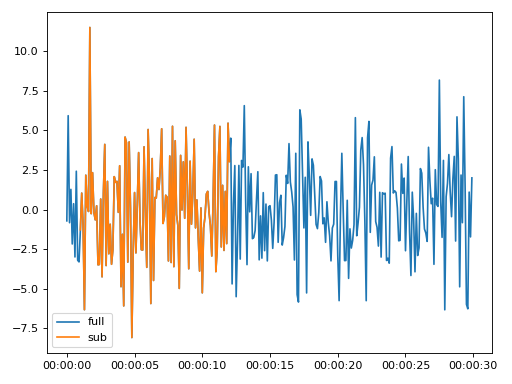
Another option is to use negative sample numbers which counts back from the end of the time data.
>>> import matplotlib.pyplot as plt
>>> from resistics.testing import time_data_random
>>> from resistics.time import Subsamples
>>> time_data = time_data_random(n_samples=300)
>>> print(time_data.metadata.first_time, time_data.metadata.last_time)
2020-01-01 00:00:00 2020-01-01 00:00:29.9
>>> process = Subsamples(from_sample=-100, to_sample=-50)
>>> subsample = process.run(time_data)
>>> print(subsample.metadata.first_time, subsample.metadata.last_time)
2020-01-01 00:00:20 2020-01-01 00:00:25
>>> subsample.metadata.n_samples
51
>>> plt.plot(time_data.get_timestamps(), time_data["Ex"], label="full")
>>> plt.plot(subsample.get_timestamps(), subsample["Ex"], label="sub")
>>> plt.legend(loc=3)
>>> plt.tight_layout()
>>> plt.show()
(
Source code,png,hires.png,pdf)
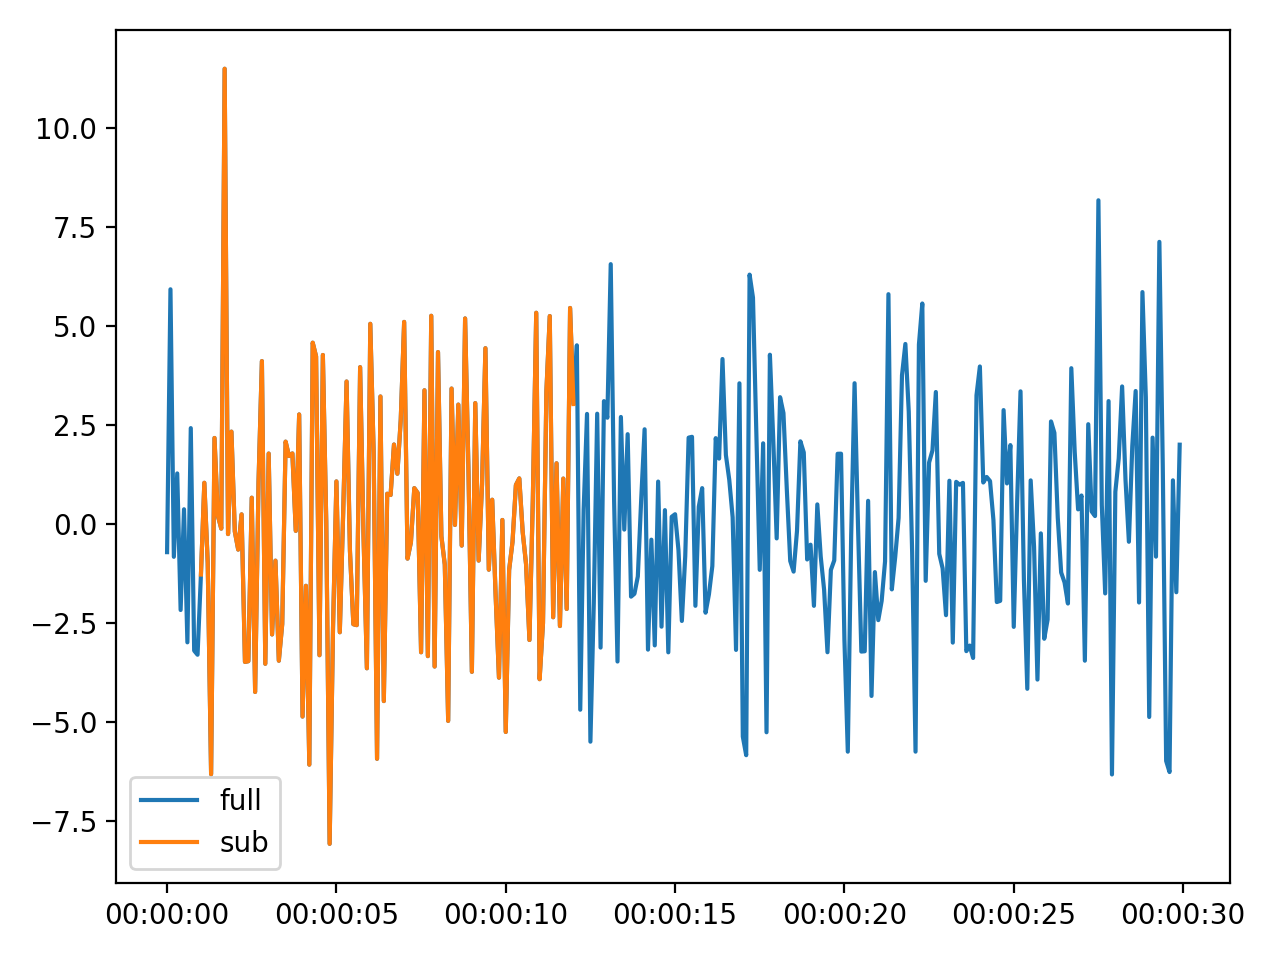
If from_sample is not passed, it will be set to 0. If to_sample is not passed this will default to the last sample.
>>> import matplotlib.pyplot as plt
>>> from resistics.testing import time_data_random
>>> from resistics.time import Subsamples
>>> time_data = time_data_random(n_samples=300)
>>> print(time_data.metadata.first_time, time_data.metadata.last_time)
2020-01-01 00:00:00 2020-01-01 00:00:29.9
>>> process = Subsamples(to_sample=100)
>>> subsample = process.run(time_data)
>>> print(subsample.metadata.first_time, subsample.metadata.last_time)
2020-01-01 00:00:00 2020-01-01 00:00:10
>>> subsample.metadata.n_samples
101
>>> plt.plot(time_data.get_timestamps(), time_data["Ex"], label="full")
>>> plt.plot(subsample.get_timestamps(), subsample["Ex"], label="sub")
>>> plt.legend(loc=3)
>>> plt.tight_layout()
>>> plt.show()
(
Source code,png,hires.png,pdf)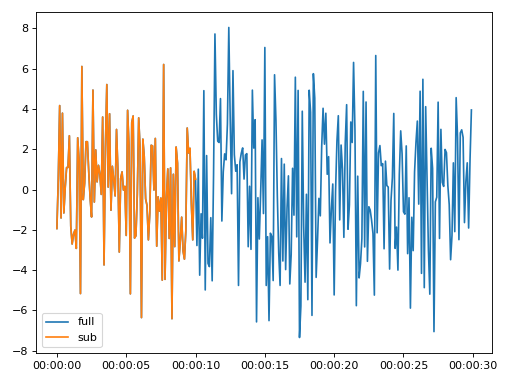
See also
SubsectionFor taking a subsection using dates
Show JSON schema
{
   "title": "Subsamples",
   "description": "Get a subsamples of time data, an alternative to getting a subsection by\ntimes\n\nParameters\n----------\nfrom_sample : int\n    Sample to begin from\nto_time : DateTimeLike\n    Sample to end at\n\nExamples\n--------\nTaking subsample using positive sample numbers. Sample 0 is the first\nsample and sample -1 is the last sample.\n\n.. plot::\n    :width: 90%\n\n    >>> import matplotlib.pyplot as plt\n    >>> from resistics.testing import time_data_random\n    >>> from resistics.time import Subsamples\n    >>> time_data = time_data_random(n_samples=300)\n    >>> print(time_data.metadata.first_time, time_data.metadata.last_time)\n    2020-01-01 00:00:00 2020-01-01 00:00:29.9\n    >>> process = Subsamples(from_sample=10, to_sample=120)\n    >>> subsample = process.run(time_data)\n    >>> print(subsample.metadata.first_time, subsample.metadata.last_time)\n    2020-01-01 00:00:01 2020-01-01 00:00:12\n    >>> subsample.metadata.n_samples\n    111\n    >>> plt.plot(time_data.get_timestamps(), time_data[\"Ex\"], label=\"full\") # doctest: +SKIP\n    >>> plt.plot(subsample.get_timestamps(), subsample[\"Ex\"], label=\"sub\") # doctest: +SKIP\n    >>> plt.legend(loc=3) # doctest: +SKIP\n    >>> plt.tight_layout() # doctest: +SKIP\n    >>> plt.show() # doctest: +SKIP\n\nAnother option is to use negative sample numbers which counts back from the\nend of the time data.\n\n.. plot::\n    :width: 90%\n\n    >>> import matplotlib.pyplot as plt\n    >>> from resistics.testing import time_data_random\n    >>> from resistics.time import Subsamples\n    >>> time_data = time_data_random(n_samples=300)\n    >>> print(time_data.metadata.first_time, time_data.metadata.last_time)\n    2020-01-01 00:00:00 2020-01-01 00:00:29.9\n    >>> process = Subsamples(from_sample=-100, to_sample=-50)\n    >>> subsample = process.run(time_data)\n    >>> print(subsample.metadata.first_time, subsample.metadata.last_time)\n    2020-01-01 00:00:20 2020-01-01 00:00:25\n    >>> subsample.metadata.n_samples\n    51\n    >>> plt.plot(time_data.get_timestamps(), time_data[\"Ex\"], label=\"full\") # doctest: +SKIP\n    >>> plt.plot(subsample.get_timestamps(), subsample[\"Ex\"], label=\"sub\") # doctest: +SKIP\n    >>> plt.legend(loc=3) # doctest: +SKIP\n    >>> plt.tight_layout() # doctest: +SKIP\n    >>> plt.show() # doctest: +SKIP\n\nIf from_sample is not passed, it will be set to 0. If to_sample is not\npassed this will default to the last sample.\n\n.. plot::\n    :width: 90%\n\n    >>> import matplotlib.pyplot as plt\n    >>> from resistics.testing import time_data_random\n    >>> from resistics.time import Subsamples\n    >>> time_data = time_data_random(n_samples=300)\n    >>> print(time_data.metadata.first_time, time_data.metadata.last_time)\n    2020-01-01 00:00:00 2020-01-01 00:00:29.9\n    >>> process = Subsamples(to_sample=100)\n    >>> subsample = process.run(time_data)\n    >>> print(subsample.metadata.first_time, subsample.metadata.last_time)\n    2020-01-01 00:00:00 2020-01-01 00:00:10\n    >>> subsample.metadata.n_samples\n    101\n    >>> plt.plot(time_data.get_timestamps(), time_data[\"Ex\"], label=\"full\") # doctest: +SKIP\n    >>> plt.plot(subsample.get_timestamps(), subsample[\"Ex\"], label=\"sub\") # doctest: +SKIP\n    >>> plt.legend(loc=3) # doctest: +SKIP\n    >>> plt.tight_layout() # doctest: +SKIP\n    >>> plt.show() # doctest: +SKIP\n\nSee Also\n--------\nSubsection : For taking a subsection using dates",
   "type": "object",
   "properties": {
      "name": {
         "title": "Name",
         "type": "string"
      },
      "from_sample": {
         "title": "From Sample",
         "type": "integer"
      },
      "to_sample": {
         "title": "To Sample",
         "type": "integer"
      }
   }
}
- run(time_data: TimeData) TimeData[source]#
Take a subsection from TimeData
- Parameters:
time_data (TimeData) – TimeData to take subsection from
- Returns:
Subsection TimeData
- Return type:
- Raises:
ProcessRunError – If from_sample is not less than to_sample
ProcessRunError – If from_sample is out of range
ProcessRunError – If to_sample is out of range
- pydantic model resistics.time.InterpolateNans[source]#
Bases:
TimeProcessInterpolate nan values in the data
Preserve the data type of the input time data
Examples
>>> from resistics.testing import time_data_with_nans
>>> from resistics.time import InterpolateNans
>>> time_data = time_data_with_nans()
>>> time_data["Hx"]
array([nan,  2.,  3.,  5.,  1.,  2.,  3.,  4.,  2.,  6.,  7., nan, nan,
        4.,  3.,  2.], dtype=float32)
>>> process = InterpolateNans()
>>> time_data_new = process.run(time_data)
>>> time_data_new["Hx"]
array([2., 2., 3., 5., 1., 2., 3., 4., 2., 6., 7., 6., 5., 4., 3., 2.],
      dtype=float32)
Show JSON schema
{
   "title": "InterpolateNans",
   "description": "Interpolate nan values in the data\n\nPreserve the data type of the input time data\n\nExamples\n--------\n>>> from resistics.testing import time_data_with_nans\n>>> from resistics.time import InterpolateNans\n>>> time_data = time_data_with_nans()\n>>> time_data[\"Hx\"]\narray([nan,  2.,  3.,  5.,  1.,  2.,  3.,  4.,  2.,  6.,  7., nan, nan,\n        4.,  3.,  2.], dtype=float32)\n>>> process = InterpolateNans()\n>>> time_data_new = process.run(time_data)\n>>> time_data_new[\"Hx\"]\narray([2., 2., 3., 5., 1., 2., 3., 4., 2., 6., 7., 6., 5., 4., 3., 2.],\n      dtype=float32)",
   "type": "object",
   "properties": {
      "name": {
         "title": "Name",
         "type": "string"
      }
   }
}
- pydantic model resistics.time.RemoveMean[source]#
Bases:
TimeProcessRemove channel mean value from each channel
Preserve the data type of the input time data
Examples
>>> import numpy as np
>>> from resistics.testing import time_data_simple
>>> from resistics.time import RemoveMean
>>> time_data = time_data_simple()
>>> process = RemoveMean()
>>> time_data_new = process.run(time_data)
>>> time_data_new["Hx"]
array([-2.5, -1.5, -0.5,  1.5, -2.5, -1.5, -0.5,  0.5, -1.5,  2.5,  3.5,
        2.5,  1.5,  0.5, -0.5, -1.5], dtype=float32)
>>> hx_test = time_data["Hx"] - np.mean(time_data["Hx"])
>>> hx_test
array([-2.5, -1.5, -0.5,  1.5, -2.5, -1.5, -0.5,  0.5, -1.5,  2.5,  3.5,
        2.5,  1.5,  0.5, -0.5, -1.5], dtype=float32)
>>> np.all(hx_test == time_data_new["Hx"])
True
Show JSON schema
{
   "title": "RemoveMean",
   "description": "Remove channel mean value from each channel\n\nPreserve the data type of the input time data\n\nExamples\n--------\n>>> import numpy as np\n>>> from resistics.testing import time_data_simple\n>>> from resistics.time import RemoveMean\n>>> time_data = time_data_simple()\n>>> process = RemoveMean()\n>>> time_data_new = process.run(time_data)\n>>> time_data_new[\"Hx\"]\narray([-2.5, -1.5, -0.5,  1.5, -2.5, -1.5, -0.5,  0.5, -1.5,  2.5,  3.5,\n        2.5,  1.5,  0.5, -0.5, -1.5], dtype=float32)\n>>> hx_test = time_data[\"Hx\"] - np.mean(time_data[\"Hx\"])\n>>> hx_test\narray([-2.5, -1.5, -0.5,  1.5, -2.5, -1.5, -0.5,  0.5, -1.5,  2.5,  3.5,\n        2.5,  1.5,  0.5, -0.5, -1.5], dtype=float32)\n>>> np.all(hx_test == time_data_new[\"Hx\"])\nTrue",
   "type": "object",
   "properties": {
      "name": {
         "title": "Name",
         "type": "string"
      }
   }
}
- pydantic model resistics.time.Add[source]#
Bases:
TimeProcessAdd values to channels
Add can be used to add a constant value to all channels or values for specific channels can be provided.
Add preserves the data type of the original data
- Parameters:
add (Union[float, Dict[str, float]]) – Either a scalar to add to all channels or dictionary with values to add to each channel
Examples
Using a constant value for all channels passed as a scalar
>>> from resistics.testing import time_data_ones
>>> from resistics.time import Add
>>> time_data = time_data_ones()
>>> process = Add(add=5)
>>> time_data_new = process.run(time_data)
>>> time_data_new["Ex"] - time_data["Ex"]
array([5., 5., 5., 5., 5., 5., 5., 5., 5., 5.], dtype=float32)
>>> time_data_new["Ey"] - time_data["Ey"]
array([5., 5., 5., 5., 5., 5., 5., 5., 5., 5.], dtype=float32)
Variable values for the channels provided as a dictionary
>>> time_data = time_data_ones()
>>> process = Add(add={"Ex": 3, "Hy": -7})
>>> time_data_new = process.run(time_data)
>>> time_data_new["Ex"] - time_data["Ex"]
array([3., 3., 3., 3., 3., 3., 3., 3., 3., 3.], dtype=float32)
>>> time_data_new["Hy"] - time_data["Hy"]
array([-7., -7., -7., -7., -7., -7., -7., -7., -7., -7.], dtype=float32)
>>> time_data_new["Ey"] - time_data["Ey"]
array([0., 0., 0., 0., 0., 0., 0., 0., 0., 0.], dtype=float32)
Show JSON schema
{
   "title": "Add",
   "description": "Add values to channels\n\nAdd can be used to add a constant value to all channels or values for\nspecific channels can be provided.\n\nAdd preserves the data type of the original data\n\nParameters\n----------\nadd : Union[float, Dict[str, float]]\n    Either a scalar to add to all channels or dictionary with values to\n    add to each channel\n\nExamples\n--------\nUsing a constant value for all channels passed as a scalar\n\n>>> from resistics.testing import time_data_ones\n>>> from resistics.time import Add\n>>> time_data = time_data_ones()\n>>> process = Add(add=5)\n>>> time_data_new = process.run(time_data)\n>>> time_data_new[\"Ex\"] - time_data[\"Ex\"]\narray([5., 5., 5., 5., 5., 5., 5., 5., 5., 5.], dtype=float32)\n>>> time_data_new[\"Ey\"] - time_data[\"Ey\"]\narray([5., 5., 5., 5., 5., 5., 5., 5., 5., 5.], dtype=float32)\n\nVariable values for the channels provided as a dictionary\n\n>>> time_data = time_data_ones()\n>>> process = Add(add={\"Ex\": 3, \"Hy\": -7})\n>>> time_data_new = process.run(time_data)\n>>> time_data_new[\"Ex\"] - time_data[\"Ex\"]\narray([3., 3., 3., 3., 3., 3., 3., 3., 3., 3.], dtype=float32)\n>>> time_data_new[\"Hy\"] - time_data[\"Hy\"]\narray([-7., -7., -7., -7., -7., -7., -7., -7., -7., -7.], dtype=float32)\n>>> time_data_new[\"Ey\"] - time_data[\"Ey\"]\narray([0., 0., 0., 0., 0., 0., 0., 0., 0., 0.], dtype=float32)",
   "type": "object",
   "properties": {
      "name": {
         "title": "Name",
         "type": "string"
      },
      "add": {
         "title": "Add",
         "anyOf": [
            {
               "type": "number"
            },
            {
               "type": "object",
               "additionalProperties": {
                  "type": "number"
               }
            }
         ]
      }
   },
   "required": [
      "add"
   ]
}
- pydantic model resistics.time.Multiply[source]#
Bases:
TimeProcessMultiply channels by values
Multiply can be used to add a constant value to all channels or values for specific channels can be provided.
Multiply preseves the original type of the time data
- Parameters:
multiplier (Union[Dict[str, float], float]) – Either a float to multiply all channels with the same value or a dictionary to specify different values for each channel
Examples
Using a constant value for all channels passed as a scalar
>>> from resistics.testing import time_data_ones
>>> from resistics.time import Multiply
>>> time_data = time_data_ones()
>>> process = Multiply(multiplier=5)
>>> time_data_new = process.run(time_data)
>>> time_data_new["Ex"]/time_data["Ex"]
array([5., 5., 5., 5., 5., 5., 5., 5., 5., 5.], dtype=float32)
>>> time_data_new["Ey"]/time_data["Ey"]
array([5., 5., 5., 5., 5., 5., 5., 5., 5., 5.], dtype=float32)
Variable values for the channels provided as a dictionary
>>> time_data = time_data_ones()
>>> process = Multiply(multiplier={"Ex": 3, "Hy": -7})
>>> time_data_new = process.run(time_data)
>>> time_data_new["Ex"]/time_data["Ex"]
array([3., 3., 3., 3., 3., 3., 3., 3., 3., 3.], dtype=float32)
>>> time_data_new["Hy"]/time_data["Hy"]
array([-7., -7., -7., -7., -7., -7., -7., -7., -7., -7.], dtype=float32)
>>> time_data_new["Ey"]/time_data["Ey"]
array([1., 1., 1., 1., 1., 1., 1., 1., 1., 1.], dtype=float32)
Show JSON schema
{
   "title": "Multiply",
   "description": "Multiply channels by values\n\nMultiply can be used to add a constant value to all channels or values for\nspecific channels can be provided.\n\nMultiply preseves the original type of the time data\n\nParameters\n----------\nmultiplier : Union[Dict[str, float], float]\n    Either a float to multiply all channels with the same value or a\n    dictionary to specify different values for each channel\n\nExamples\n--------\nUsing a constant value for all channels passed as a scalar\n\n>>> from resistics.testing import time_data_ones\n>>> from resistics.time import Multiply\n>>> time_data = time_data_ones()\n>>> process = Multiply(multiplier=5)\n>>> time_data_new = process.run(time_data)\n>>> time_data_new[\"Ex\"]/time_data[\"Ex\"]\narray([5., 5., 5., 5., 5., 5., 5., 5., 5., 5.], dtype=float32)\n>>> time_data_new[\"Ey\"]/time_data[\"Ey\"]\narray([5., 5., 5., 5., 5., 5., 5., 5., 5., 5.], dtype=float32)\n\nVariable values for the channels provided as a dictionary\n\n>>> time_data = time_data_ones()\n>>> process = Multiply(multiplier={\"Ex\": 3, \"Hy\": -7})\n>>> time_data_new = process.run(time_data)\n>>> time_data_new[\"Ex\"]/time_data[\"Ex\"]\narray([3., 3., 3., 3., 3., 3., 3., 3., 3., 3.], dtype=float32)\n>>> time_data_new[\"Hy\"]/time_data[\"Hy\"]\narray([-7., -7., -7., -7., -7., -7., -7., -7., -7., -7.], dtype=float32)\n>>> time_data_new[\"Ey\"]/time_data[\"Ey\"]\narray([1., 1., 1., 1., 1., 1., 1., 1., 1., 1.], dtype=float32)",
   "type": "object",
   "properties": {
      "name": {
         "title": "Name",
         "type": "string"
      },
      "multiplier": {
         "title": "Multiplier",
         "anyOf": [
            {
               "type": "number"
            },
            {
               "type": "object",
               "additionalProperties": {
                  "type": "number"
               }
            }
         ]
      }
   },
   "required": [
      "multiplier"
   ]
}
- pydantic model resistics.time.LowPass[source]#
Bases:
TimeProcessApply low pass filter
- Parameters:
Examples
Low pass to remove 20 Hz from a time series sampled at 50 Hz
import matplotlib.pyplot as plt
from resistics.testing import time_data_periodic
from resistics.time import LowPass
time_data = time_data_periodic([10, 50], fs=250, n_samples=100)
process = LowPass(cutoff=30)
filtered = process.run(time_data)
plt.plot(time_data.get_timestamps(), time_data["chan1"], label="original")
plt.plot(filtered.get_timestamps(), filtered["chan1"], label="filtered")
plt.legend(loc=3)
plt.tight_layout()
plt.plot()
(
Source code,png,hires.png,pdf)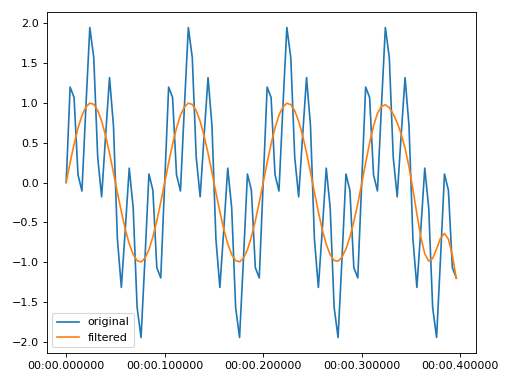
Show JSON schema
{
   "title": "LowPass",
   "description": "Apply low pass filter\n\nParameters\n----------\ncutoff : float\n    The cutoff for the low pass\norder : int, optional\n    Order of the filter, by default 10\n\nExamples\n--------\nLow pass to remove 20 Hz from a time series sampled at 50 Hz\n\n.. plot::\n    :width: 90%\n\n    import matplotlib.pyplot as plt\n    from resistics.testing import time_data_periodic\n    from resistics.time import LowPass\n    time_data = time_data_periodic([10, 50], fs=250, n_samples=100)\n    process = LowPass(cutoff=30)\n    filtered = process.run(time_data)\n    plt.plot(time_data.get_timestamps(), time_data[\"chan1\"], label=\"original\")\n    plt.plot(filtered.get_timestamps(), filtered[\"chan1\"], label=\"filtered\")\n    plt.legend(loc=3)\n    plt.tight_layout()\n    plt.plot()",
   "type": "object",
   "properties": {
      "name": {
         "title": "Name",
         "type": "string"
      },
      "cutoff": {
         "title": "Cutoff",
         "type": "number"
      },
      "order": {
         "title": "Order",
         "default": 10,
         "type": "integer"
      }
   },
   "required": [
      "cutoff"
   ]
}
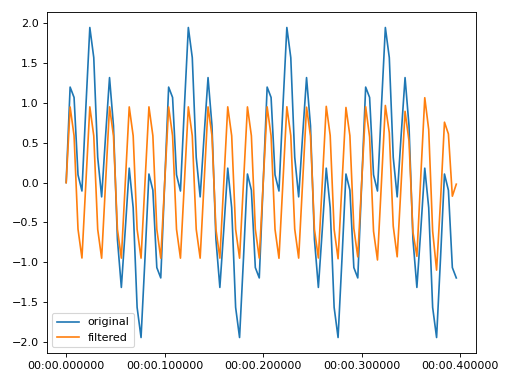
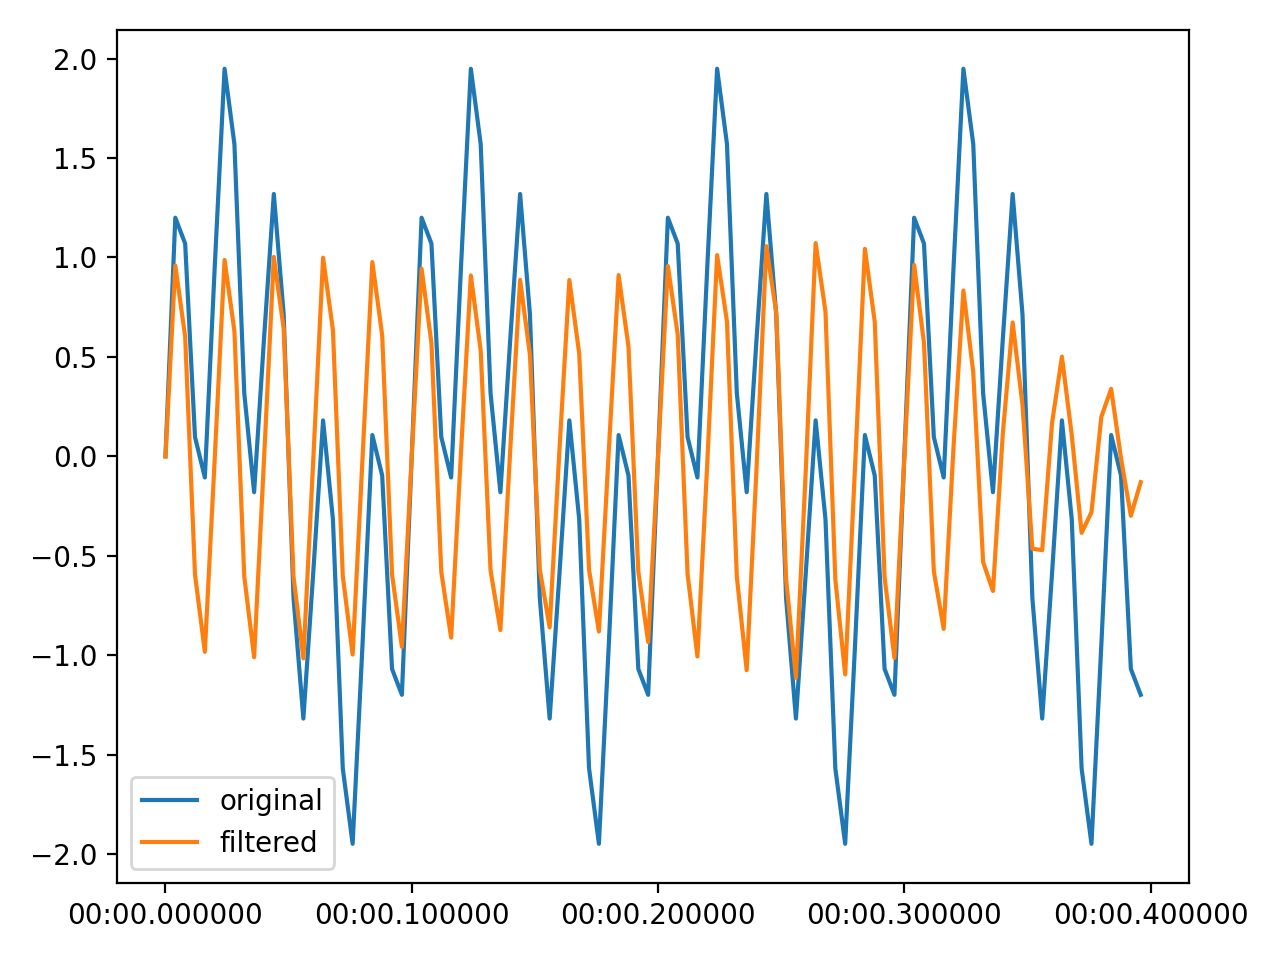
- pydantic model resistics.time.HighPass[source]#
Bases:
TimeProcessHigh pass filter time data
- Parameters:
Examples
High pass to remove 3 Hz from signal sampled at 50 Hz
import matplotlib.pyplot as plt
from resistics.testing import time_data_periodic
from resistics.time import HighPass
time_data = time_data_periodic([10, 50], fs=250, n_samples=100)
process = HighPass(cutoff=30)
filtered = process.run(time_data)
plt.plot(time_data.get_timestamps(), time_data["chan1"], label="original")
plt.plot(filtered.get_timestamps(), filtered["chan1"], label="filtered")
plt.legend(loc=3)
plt.tight_layout()
plt.plot()
(
Source code,png,hires.png,pdf)
Show JSON schema
{
   "title": "HighPass",
   "description": "High pass filter time data\n\nParameters\n----------\ncutoff : float\n    Cutoff for the high pass filter\norder : int, optional\n    Order of the filter, by default 10\n\nExamples\n--------\nHigh pass to remove 3 Hz from signal sampled at 50 Hz\n\n.. plot::\n    :width: 90%\n\n    import matplotlib.pyplot as plt\n    from resistics.testing import time_data_periodic\n    from resistics.time import HighPass\n    time_data = time_data_periodic([10, 50], fs=250, n_samples=100)\n    process = HighPass(cutoff=30)\n    filtered = process.run(time_data)\n    plt.plot(time_data.get_timestamps(), time_data[\"chan1\"], label=\"original\")\n    plt.plot(filtered.get_timestamps(), filtered[\"chan1\"], label=\"filtered\")\n    plt.legend(loc=3)\n    plt.tight_layout()\n    plt.plot()",
   "type": "object",
   "properties": {
      "name": {
         "title": "Name",
         "type": "string"
      },
      "cutoff": {
         "title": "Cutoff",
         "type": "number"
      },
      "order": {
         "title": "Order",
         "default": 10,
         "type": "integer"
      }
   },
   "required": [
      "cutoff"
   ]
}
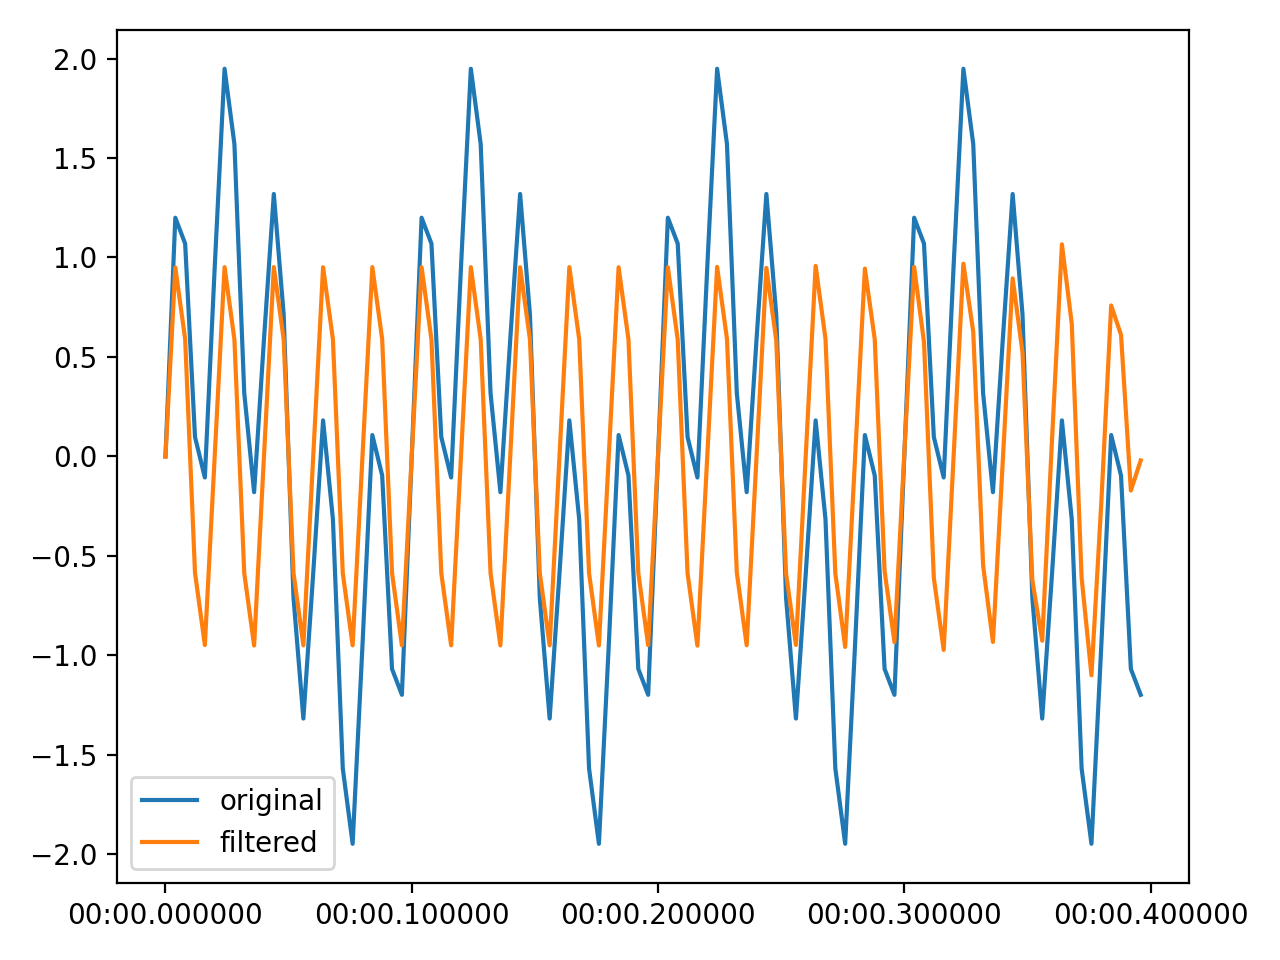
- pydantic model resistics.time.BandPass[source]#
Bases:
TimeProcessBand pass filter time data
- Parameters:
Examples
Band pass to isolate 12 Hz signal
import matplotlib.pyplot as plt
from resistics.testing import time_data_periodic
from resistics.time import BandPass
time_data = time_data_periodic([10, 50], fs=250, n_samples=100)
process = BandPass(cutoff_low=45, cutoff_high=55)
filtered = process.run(time_data)
plt.plot(time_data.get_timestamps(), time_data["chan1"], label="original")
plt.plot(filtered.get_timestamps(), filtered["chan1"], label="filtered")
plt.legend(loc=3)
plt.tight_layout()
plt.plot()
(
Source code,png,hires.png,pdf)
Show JSON schema
{
   "title": "BandPass",
   "description": "Band pass filter time data\n\nParameters\n----------\ncutoff_low : float\n    The low cutoff for the band pass filter\ncutoff_high : float\n    The high cutoff for the band pass filter\norder : int, optional\n    The order of the filter, by default 10\n\nExamples\n--------\nBand pass to isolate 12 Hz signal\n\n.. plot::\n    :width: 90%\n\n    import matplotlib.pyplot as plt\n    from resistics.testing import time_data_periodic\n    from resistics.time import BandPass\n    time_data = time_data_periodic([10, 50], fs=250, n_samples=100)\n    process = BandPass(cutoff_low=45, cutoff_high=55)\n    filtered = process.run(time_data)\n    plt.plot(time_data.get_timestamps(), time_data[\"chan1\"], label=\"original\")\n    plt.plot(filtered.get_timestamps(), filtered[\"chan1\"], label=\"filtered\")\n    plt.legend(loc=3)\n    plt.tight_layout()\n    plt.plot()",
   "type": "object",
   "properties": {
      "name": {
         "title": "Name",
         "type": "string"
      },
      "cutoff_low": {
         "title": "Cutoff Low",
         "type": "number"
      },
      "cutoff_high": {
         "title": "Cutoff High",
         "type": "number"
      },
      "order": {
         "title": "Order",
         "default": 10,
         "type": "integer"
      }
   },
   "required": [
      "cutoff_low",
      "cutoff_high"
   ]
}
- run(time_data: TimeData) TimeData[source]#
Apply the band pass filter
- Parameters:
time_data (TimeData) – The input TimeData
- Returns:
The band pass filtered TimeData
- Return type:
- Raises:
ProcessRunError – If cutoff_low > cutoff_high
ProcessRunError – If cutoff_high > nyquist
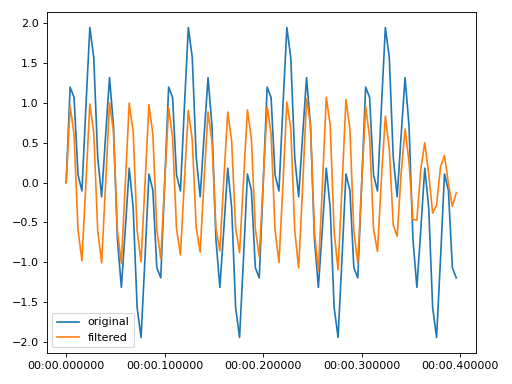
- pydantic model resistics.time.Notch[source]#
Bases:
TimeProcessNotch filter time data
- Parameters:
Examples
Notch to remove a 50 Hz signal, for example powerline noise
import matplotlib.pyplot as plt
from resistics.testing import time_data_periodic
from resistics.time import Notch
time_data = time_data_periodic([10, 50], fs=250, n_samples=100)
process = Notch(notch=50, band=10)
filtered = process.run(time_data)
plt.plot(time_data.get_timestamps(), time_data["chan1"], label="original")
plt.plot(filtered.get_timestamps(), filtered["chan1"], label="filtered")
plt.legend(loc=3)
plt.tight_layout()
plt.plot()
(
Source code,png,hires.png,pdf)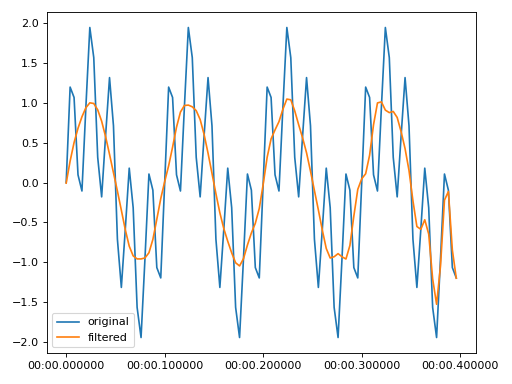
Show JSON schema
{
   "title": "Notch",
   "description": "Notch filter time data\n\nParameters\n----------\nnotch : float\n    The frequency to notch\nband : Optional[float], optional\n    The bandwidth of the filter, by default None\norder : int, optional\n    The order of the filter, by default 10\n\nExamples\n--------\nNotch to remove a 50 Hz signal, for example powerline noise\n\n.. plot::\n    :width: 90%\n\n    import matplotlib.pyplot as plt\n    from resistics.testing import time_data_periodic\n    from resistics.time import Notch\n    time_data = time_data_periodic([10, 50], fs=250, n_samples=100)\n    process = Notch(notch=50, band=10)\n    filtered = process.run(time_data)\n    plt.plot(time_data.get_timestamps(), time_data[\"chan1\"], label=\"original\")\n    plt.plot(filtered.get_timestamps(), filtered[\"chan1\"], label=\"filtered\")\n    plt.legend(loc=3)\n    plt.tight_layout()\n    plt.plot()",
   "type": "object",
   "properties": {
      "name": {
         "title": "Name",
         "type": "string"
      },
      "notch": {
         "title": "Notch",
         "type": "number"
      },
      "band": {
         "title": "Band",
         "type": "number"
      },
      "order": {
         "title": "Order",
         "default": 10,
         "type": "integer"
      }
   },
   "required": [
      "notch"
   ]
}
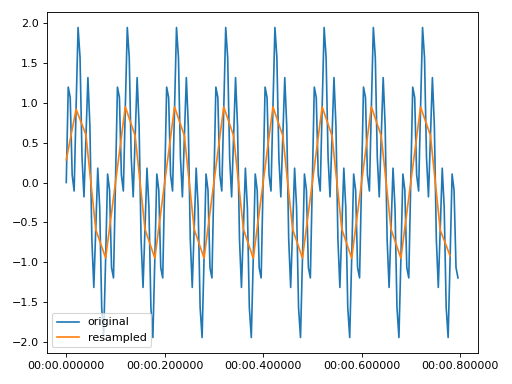
- pydantic model resistics.time.Resample[source]#
Bases:
TimeProcessResample TimeData
Note that resampling is done on np.float64 data and this will lead to a temporary increase in memory usage. Once resampling is complete, the data is converted back to its original data type.
- Parameters:
new_fs (int) – The new sampling frequency
Examples
Resample the data from 250 Hz to 50 Hz
>>> import matplotlib.pyplot as plt
>>> from resistics.testing import time_data_periodic
>>> from resistics.time import Resample
>>> time_data = time_data_periodic([10, 50], fs=250, n_samples=200)
>>> print(time_data.metadata.n_samples, time_data.metadata.first_time, time_data.metadata.last_time)
200 2020-01-01 00:00:00 2020-01-01 00:00:00.796
>>> process = Resample(new_fs=50)
>>> resampled = process.run(time_data)
>>> print(resampled.metadata.n_samples, resampled.metadata.first_time, resampled.metadata.last_time)
40 2020-01-01 00:00:00 2020-01-01 00:00:00.78
>>> plt.plot(time_data.get_timestamps(), time_data["chan1"], label="original")
>>> plt.plot(resampled.get_timestamps(), resampled["chan1"], label="resampled")
>>> plt.legend(loc=3)
>>> plt.tight_layout()
>>> plt.show()
(
Source code,png,hires.png,pdf)
Show JSON schema
{
   "title": "Resample",
   "description": "Resample TimeData\n\nNote that resampling is done on np.float64 data and this will lead to a\ntemporary increase in memory usage. Once resampling is complete, the data is\nconverted back to its original data type.\n\nParameters\n----------\nnew_fs : int\n    The new sampling frequency\n\nExamples\n--------\nResample the data from 250 Hz to 50 Hz\n\n.. plot::\n    :width: 90%\n\n    >>> import matplotlib.pyplot as plt\n    >>> from resistics.testing import time_data_periodic\n    >>> from resistics.time import Resample\n    >>> time_data = time_data_periodic([10, 50], fs=250, n_samples=200)\n    >>> print(time_data.metadata.n_samples, time_data.metadata.first_time, time_data.metadata.last_time)\n    200 2020-01-01 00:00:00 2020-01-01 00:00:00.796\n    >>> process = Resample(new_fs=50)\n    >>> resampled = process.run(time_data)\n    >>> print(resampled.metadata.n_samples, resampled.metadata.first_time, resampled.metadata.last_time)\n    40 2020-01-01 00:00:00 2020-01-01 00:00:00.78\n    >>> plt.plot(time_data.get_timestamps(), time_data[\"chan1\"], label=\"original\") # doctest: +SKIP\n    >>> plt.plot(resampled.get_timestamps(), resampled[\"chan1\"], label=\"resampled\") # doctest: +SKIP\n    >>> plt.legend(loc=3) # doctest: +SKIP\n    >>> plt.tight_layout() # doctest: +SKIP\n    >>> plt.show() # doctest: +SKIP",
   "type": "object",
   "properties": {
      "name": {
         "title": "Name",
         "type": "string"
      },
      "new_fs": {
         "title": "New Fs",
         "type": "number"
      }
   },
   "required": [
      "new_fs"
   ]
}
- run(time_data: TimeData) TimeData[source]#
Resample TimeData
Resampling uses the polyphase method which does not assume periodicity Calculate the upsample rate and the downsampling rate and using polyphase filtering, the final sample rate is:
\[(up / down) * original sample rate\]Therefore, to get a sampling frequency of resampFreq, want:
\[(resampFreq / sampleFreq) * sampleFreq\]Use the fractions library to get up and down as integers which they are required to be.
- pydantic model resistics.time.Decimate[source]#
Bases:
TimeProcessDecimate TimeData
Warning
Data is converted to np.float64 prior to decimation. This is going to cause a temporary increase in memory usage, but decimating np.float64 delivers improved results.
The decimated data is converted back to its original data type prior to being returned.
The max_factor for a single decimation step is by default set as 3. When using np.float64 data, it is possible to use a larger decimation factor, up to 13, but this does again have an impact on results.
For more information, see https://docs.scipy.org/doc/scipy/reference/generated/scipy.signal.decimate.html
- Parameters:
factor (int) – The decimation factor
Examples
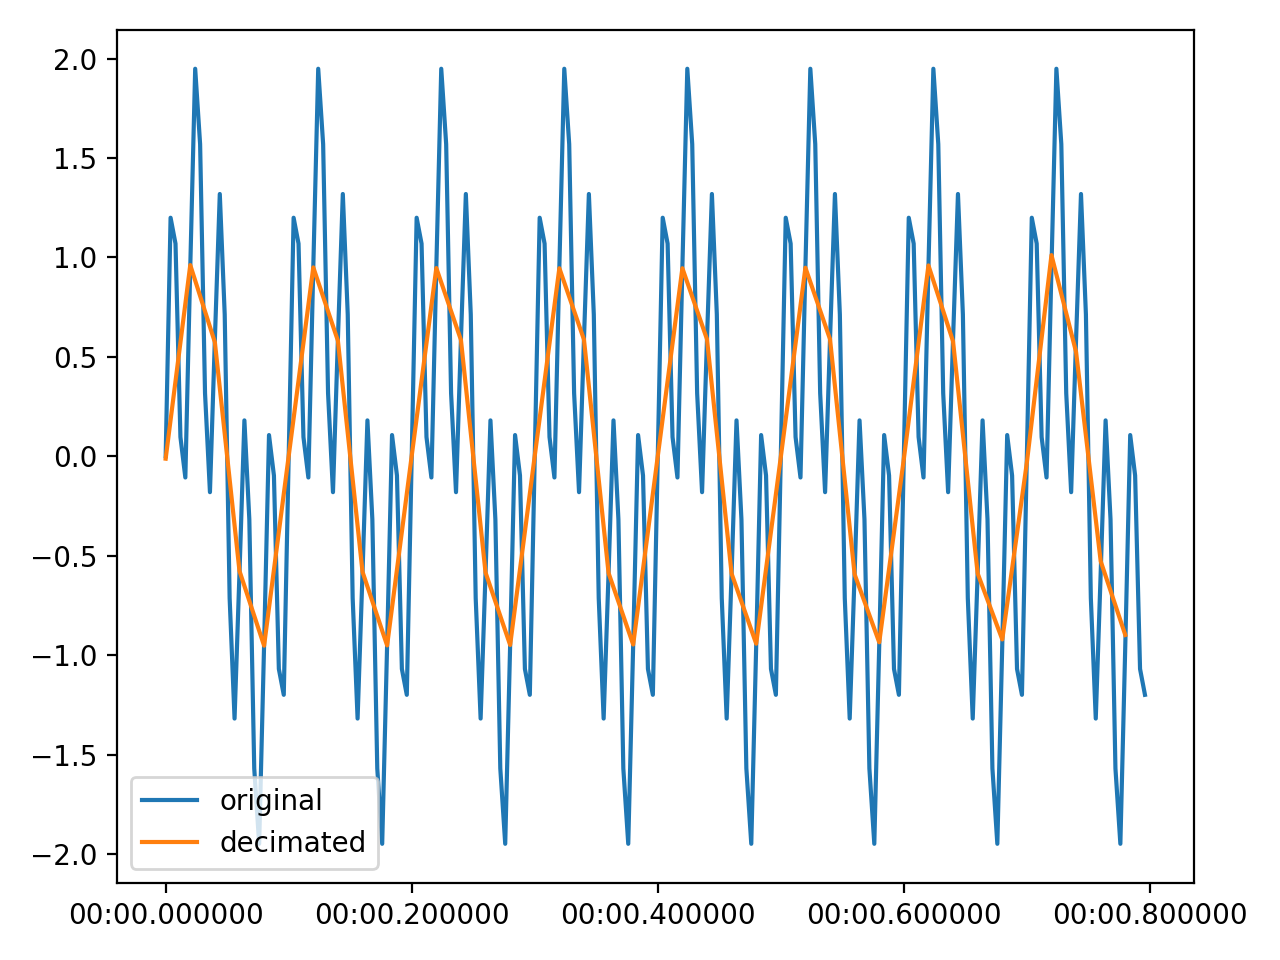
>>> import matplotlib.pyplot as plt
>>> from resistics.testing import time_data_periodic
>>> from resistics.time import Decimate
>>> time_data = time_data_periodic([10, 50], fs=250, n_samples=200)
>>> print(time_data.metadata.n_samples, time_data.metadata.first_time, time_data.metadata.last_time)
200 2020-01-01 00:00:00 2020-01-01 00:00:00.796
>>> process = Decimate(factor=5)
>>> decimated = process.run(time_data)
>>> print(decimated.metadata.n_samples, decimated.metadata.first_time, decimated.metadata.last_time)
40 2020-01-01 00:00:00 2020-01-01 00:00:00.78
>>> plt.plot(time_data.get_timestamps(), time_data["chan1"], label="original")
>>> plt.plot(decimated.get_timestamps(), decimated["chan1"], label="decimated")
>>> plt.legend(loc=3)
>>> plt.tight_layout()
>>> plt.show()
(
Source code,png,hires.png,pdf)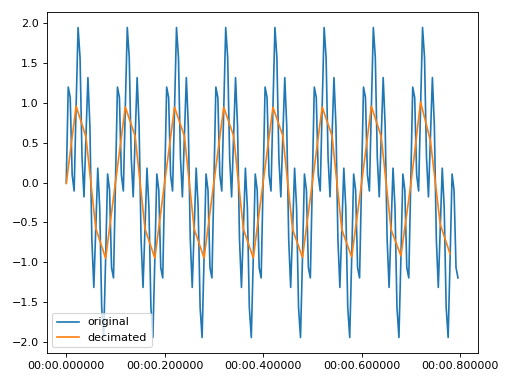
Show JSON schema
{
   "title": "Decimate",
   "description": "Decimate TimeData\n\n.. warning::\n\n    Data is converted to np.float64 prior to decimation. This is going to\n    cause a temporary increase in memory usage, but decimating np.float64\n    delivers improved results.\n\n    The decimated data is converted back to its original data type prior\n    to being returned.\n\n    The max_factor for a single decimation step is by default set as 3.\n    When using np.float64 data, it is possible to use a larger decimation\n    factor, up to 13, but this does again have an impact on results.\n\n    For more information, see\n    https://docs.scipy.org/doc/scipy/reference/generated/scipy.signal.decimate.html\n\nParameters\n----------\nfactor : int\n    The decimation factor\n\nExamples\n--------\n.. plot::\n    :width: 90%\n\n    >>> import matplotlib.pyplot as plt\n    >>> from resistics.testing import time_data_periodic\n    >>> from resistics.time import Decimate\n    >>> time_data = time_data_periodic([10, 50], fs=250, n_samples=200)\n    >>> print(time_data.metadata.n_samples, time_data.metadata.first_time, time_data.metadata.last_time)\n    200 2020-01-01 00:00:00 2020-01-01 00:00:00.796\n    >>> process = Decimate(factor=5)\n    >>> decimated = process.run(time_data)\n    >>> print(decimated.metadata.n_samples, decimated.metadata.first_time, decimated.metadata.last_time)\n    40 2020-01-01 00:00:00 2020-01-01 00:00:00.78\n    >>> plt.plot(time_data.get_timestamps(), time_data[\"chan1\"], label=\"original\") # doctest: +SKIP\n    >>> plt.plot(decimated.get_timestamps(), decimated[\"chan1\"], label=\"decimated\") # doctest: +SKIP\n    >>> plt.legend(loc=3) # doctest: +SKIP\n    >>> plt.tight_layout() # doctest: +SKIP\n    >>> plt.show() # doctest: +SKIP",
   "type": "object",
   "properties": {
      "name": {
         "title": "Name",
         "type": "string"
      },
      "factor": {
         "title": "Factor",
         "minimum": 1,
         "type": "integer"
      },
      "max_single_factor": {
         "title": "Max Single Factor",
         "default": 3,
         "minimum": 2,
         "type": "integer"
      }
   },
   "required": [
      "factor"
   ]
}
- field factor: ConstrainedIntValue [Required]#
- Constraints:
minimum = 1
- field max_single_factor: ConstrainedIntValue = 3#
- Constraints:
minimum = 2
- pydantic model resistics.time.ShiftTimestamps[source]#
Bases:
TimeProcessShift timestamps. This method is usually used when there is an offset on the sampling, so that instead of coinciding with a second or an hour, they are offset from this.
The function interpolates the original data onto the shifted timestamps.
- Parameters:
shift (float) – The shift in seconds. This must be positive as data is never extrapolated
Examples
An example shifting timestamps for TimeData with a sample period of 20 seconds (fs = 1/20 = 0.05 Hz) but with an offset of 10 seconds on the timestamps
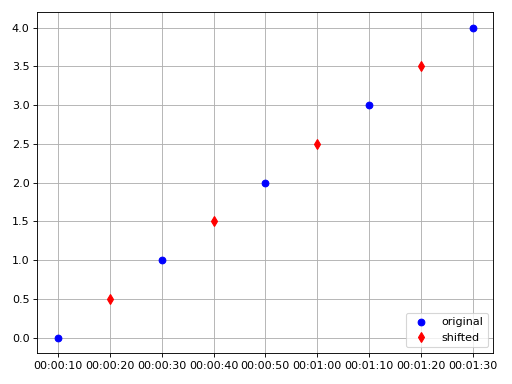
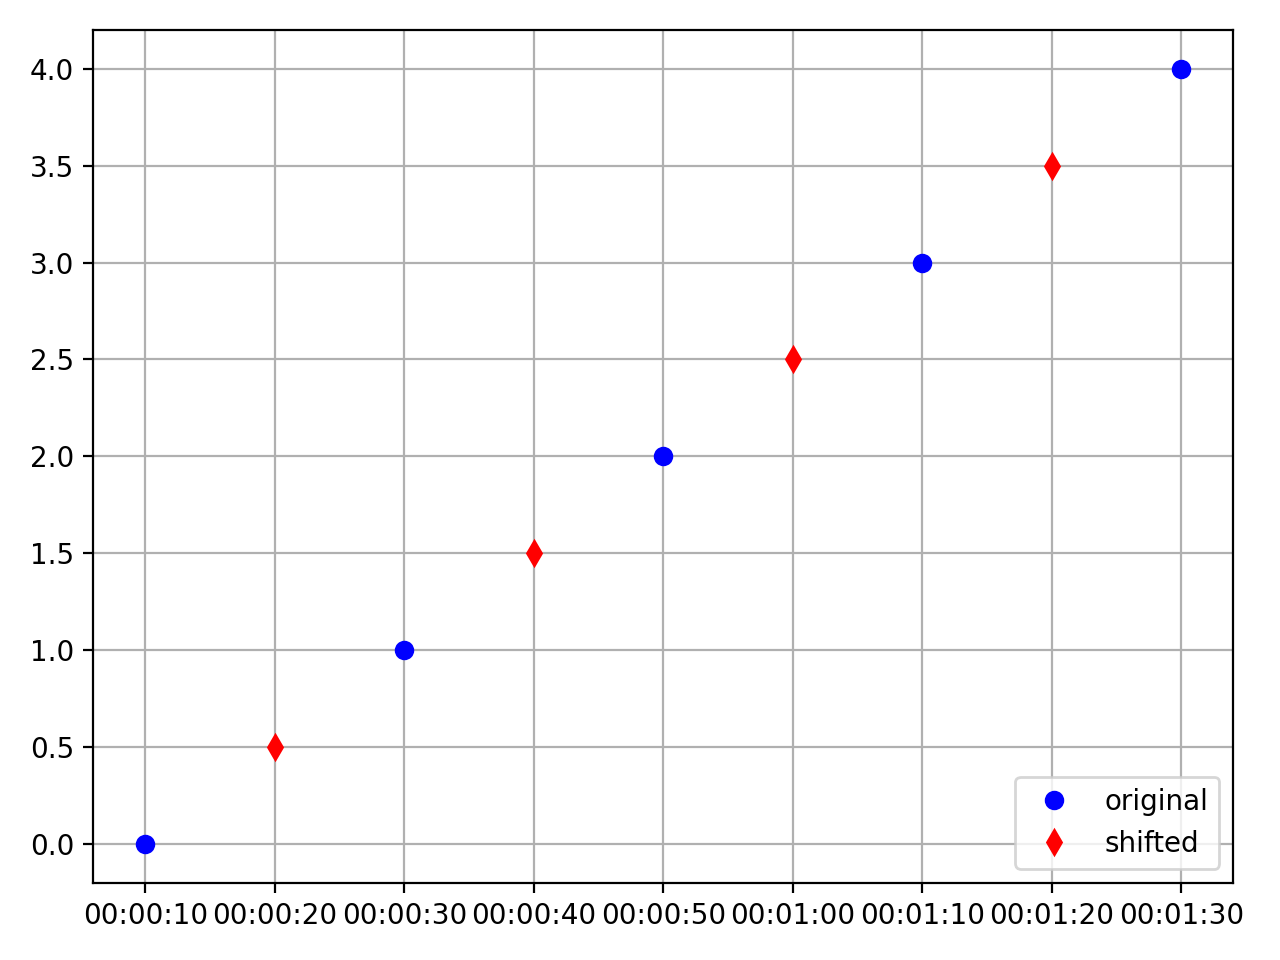
>>> from resistics.testing import time_data_with_offset
>>> from resistics.time import ShiftTimestamps
>>> time_data = time_data_with_offset(offset=10, fs=1/20, n_samples=5)
>>> [x.time().strftime('%H:%M:%S') for x in time_data.get_timestamps()]
['00:00:10', '00:00:30', '00:00:50', '00:01:10', '00:01:30']
>>> process = ShiftTimestamps(shift=10, style="linear")
>>> result = process.run(time_data)
>>> [x.time().strftime('%H:%M:%S') for x in result.get_timestamps()]
['00:00:20', '00:00:40', '00:01:00', '00:01:20']
>>> plt.plot(time_data.get_timestamps(), time_data["chan1"], "bo", label="original")
>>> plt.plot(result.get_timestamps(), result["chan1"], "rd", label="shifted")
>>> plt.legend(loc=4)
>>> plt.grid()
>>> plt.tight_layout()
>>> plt.show()
(
Source code,png,hires.png,pdf)
See also
CropTimestampsCrop timestamps to a specified time unit
Show JSON schema
{
   "title": "ShiftTimestamps",
   "description": "Shift timestamps. This method is usually used when there is an offset on the\nsampling, so that instead of coinciding with a second or an hour, they are\noffset from this.\n\nThe function interpolates the original data onto the shifted timestamps.\n\nParameters\n----------\nshift : float\n    The shift in seconds. This must be positive as data is never\n    extrapolated\n\nExamples\n--------\nAn example shifting timestamps for TimeData with a sample period of 20\nseconds (fs = 1/20 = 0.05 Hz) but with an offset of 10 seconds on the\ntimestamps\n\n.. plot::\n    :width: 90%\n\n    >>> from resistics.testing import time_data_with_offset\n    >>> from resistics.time import ShiftTimestamps\n    >>> time_data = time_data_with_offset(offset=10, fs=1/20, n_samples=5)\n    >>> [x.time().strftime('%H:%M:%S') for x in time_data.get_timestamps()]\n    ['00:00:10', '00:00:30', '00:00:50', '00:01:10', '00:01:30']\n    >>> process = ShiftTimestamps(shift=10, style=\"linear\")\n    >>> result = process.run(time_data)\n    >>> [x.time().strftime('%H:%M:%S') for x in result.get_timestamps()]\n    ['00:00:20', '00:00:40', '00:01:00', '00:01:20']\n    >>> plt.plot(time_data.get_timestamps(), time_data[\"chan1\"], \"bo\", label=\"original\") # doctest: +SKIP\n    >>> plt.plot(result.get_timestamps(), result[\"chan1\"], \"rd\", label=\"shifted\") # doctest: +SKIP\n    >>> plt.legend(loc=4) # doctest: +SKIP\n    >>> plt.grid() # doctest: +SKIP\n    >>> plt.tight_layout() # doctest: +SKIP\n    >>> plt.show() # doctest: +SKIP\n\nSee Also\n--------\nCropTimestamps : Crop timestamps to a specified time unit",
   "type": "object",
   "properties": {
      "name": {
         "title": "Name",
         "type": "string"
      },
      "shift": {
         "title": "Shift",
         "exclusiveMinimum": 0,
         "type": "number"
      },
      "style": {
         "title": "Style",
         "default": "spline",
         "enum": [
            "spline",
            "linear"
         ],
         "type": "string"
      }
   },
   "required": [
      "shift"
   ]
}
- field shift: PositiveFloat [Required]#
- Constraints:
exclusiveMinimum = 0
- run(time_data: TimeData) TimeData[source]#
Shift timestamps and interpolate data
- Parameters:
time_data (TimeData) – Input TimeData
- Returns:
TimeData with shifted timestamps and data interpolated
- Return type:
- Raises:
ProcessRunError – If the shift is greater than the sampling frequency. This method is not supposed to be used for resampling, but simply for removing an offset from timestamps
- pydantic model resistics.time.CropTimestamps[source]#
Bases:
TimeProcessCrop timestamps to make them begin at the next second or minute or hour and end one sample before the nearest second, minute or hour.
Input timestamps should be sampled coincidentally with the time unit. This can be achieved with
ShiftTimestamps.Cropping works as follows:
First times are cropped to the next time unit or maintained if they are a whole time unit already
Last times are cropped to the previous time unit or maintained if they are a whole time unit already
- Parameters:
time_unit (str) – The time unit to crop to given in pandas style time freq
Examples
An example cropping timestamps to the nearest minute.
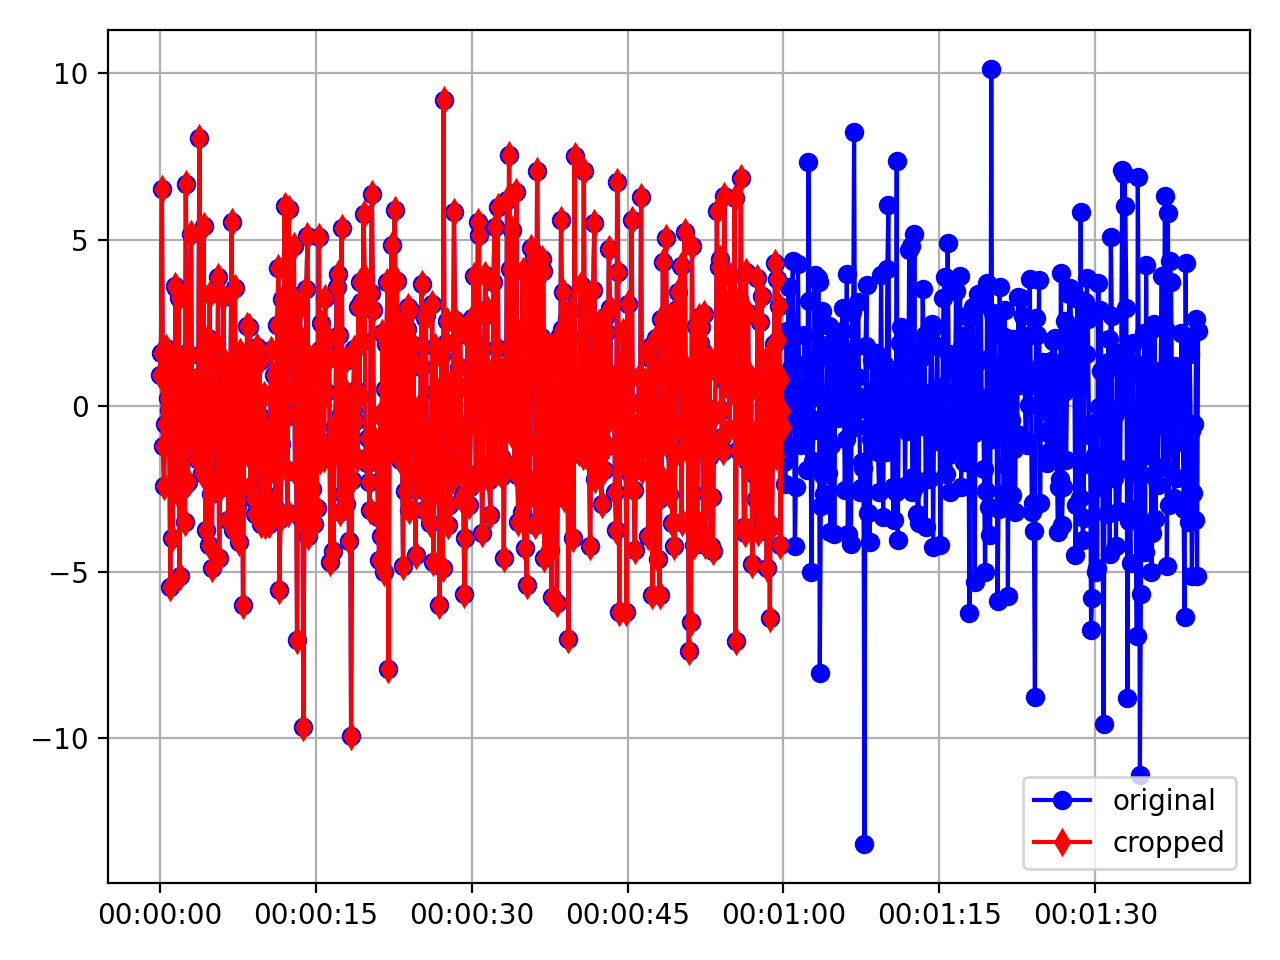
>>> from resistics.testing import time_data_random
>>> from resistics.time import CropTimestamps
>>> time_data = time_data_random(n_samples=1000)
>>> print(time_data.metadata.first_time, time_data.metadata.last_time)
2020-01-01 00:00:00 2020-01-01 00:01:39.9
>>> process = CropTimestamps(time_unit="T")
>>> result = process.run(time_data)
>>> print(result.metadata.first_time, result.metadata.last_time)
2020-01-01 00:00:00 2020-01-01 00:01:00
>>> plt.plot(time_data.get_timestamps(), time_data["Ex"], "bo-", label="original")
>>> plt.plot(result.get_timestamps(), result["Ex"], "rd-", label="cropped")
>>> plt.legend(loc=4)
>>> plt.grid()
>>> plt.tight_layout()
>>> plt.show()
(
Source code,png,hires.png,pdf)
See also
ShiftTimestampsCalculate data values on shifted timestamps
Show JSON schema
{
   "title": "CropTimestamps",
   "description": "Crop timestamps to make them begin at the next second or minute or hour\nand end one sample before the nearest second, minute or hour.\n\nInput timestamps should be sampled coincidentally with the time\nunit. This can be achieved with :class:`~ShiftTimestamps`.\n\nCropping works as follows:\n\n- First times are cropped to the next time unit or maintained if they are a\n  whole time unit already\n- Last times are cropped to the previous time unit or maintained if they are\n  a whole time unit already\n\nParameters\n----------\ntime_unit : str\n    The time unit to crop to given in pandas style time freq\n\nExamples\n--------\nAn example cropping timestamps to the nearest minute.\n\n.. plot::\n    :width: 90%\n\n    >>> from resistics.testing import time_data_random\n    >>> from resistics.time import CropTimestamps\n    >>> time_data = time_data_random(n_samples=1000)\n    >>> print(time_data.metadata.first_time, time_data.metadata.last_time)\n    2020-01-01 00:00:00 2020-01-01 00:01:39.9\n    >>> process = CropTimestamps(time_unit=\"T\")\n    >>> result = process.run(time_data)\n    >>> print(result.metadata.first_time, result.metadata.last_time)\n    2020-01-01 00:00:00 2020-01-01 00:01:00\n    >>> plt.plot(time_data.get_timestamps(), time_data[\"Ex\"], \"bo-\", label=\"original\") # doctest: +SKIP\n    >>> plt.plot(result.get_timestamps(), result[\"Ex\"], \"rd-\", label=\"cropped\") # doctest: +SKIP\n    >>> plt.legend(loc=4) # doctest: +SKIP\n    >>> plt.grid() # doctest: +SKIP\n    >>> plt.tight_layout() # doctest: +SKIP\n    >>> plt.show() # doctest: +SKIP\n\nSee Also\n--------\nShiftTimestamps : Calculate data values on shifted timestamps",
   "type": "object",
   "properties": {
      "name": {
         "title": "Name",
         "type": "string"
      },
      "time_unit": {
         "title": "Time Unit",
         "default": "s",
         "type": "string"
      }
   }
}
- resistics.time.serialize_custom_fnc(fnc: Callable) str[source]#
Serialize the custom functions
This is not really reversible and recovering parameters from ApplyFunction is not supported
- Parameters:
fnc (Callable) – Function to serialize
- Returns:
serialized output
- Return type:
- pydantic model resistics.time.ApplyFunction[source]#
Bases:
TimeProcessApply a generic functions to the time data
To be used with single argument functions that take the channel data array and a perform transformation on the data.
- Parameters:
fncs (Dict[str, Callable]) – Dictionary of channel to callable
Examples
>>> import numpy as np
>>> from resistics.testing import time_data_ones
>>> from resistics.time import ApplyFunction
>>> time_data = time_data_ones()
>>> process = ApplyFunction(fncs={"Ex": lambda x: 2*x, "Hy": lambda x: 3*x*x - 5*x + 1})
>>> result = process.run(time_data)
>>> time_data["Ex"]
array([1., 1., 1., 1., 1., 1., 1., 1., 1., 1.], dtype=float32)
>>> result["Ex"]
array([2., 2., 2., 2., 2., 2., 2., 2., 2., 2.])
>>> time_data["Hy"]
array([1., 1., 1., 1., 1., 1., 1., 1., 1., 1.], dtype=float32)
>>> result["Hy"]
array([-1., -1., -1., -1., -1., -1., -1., -1., -1., -1.])
Show JSON schema
{
   "title": "ApplyFunction",
   "description": "Apply a generic functions to the time data\n\nTo be used with single argument functions that take the channel data array\nand a perform transformation on the data.\n\nParameters\n----------\nfncs : Dict[str, Callable]\n    Dictionary of channel to callable\n\nExamples\n--------\n>>> import numpy as np\n>>> from resistics.testing import time_data_ones\n>>> from resistics.time import ApplyFunction\n>>> time_data = time_data_ones()\n>>> process = ApplyFunction(fncs={\"Ex\": lambda x: 2*x, \"Hy\": lambda x: 3*x*x - 5*x + 1})\n>>> result = process.run(time_data)\n>>> time_data[\"Ex\"]\narray([1., 1., 1., 1., 1., 1., 1., 1., 1., 1.], dtype=float32)\n>>> result[\"Ex\"]\narray([2., 2., 2., 2., 2., 2., 2., 2., 2., 2.])\n>>> time_data[\"Hy\"]\narray([1., 1., 1., 1., 1., 1., 1., 1., 1., 1.], dtype=float32)\n>>> result[\"Hy\"]\narray([-1., -1., -1., -1., -1., -1., -1., -1., -1., -1.])",
   "type": "object",
   "properties": {
      "name": {
         "title": "Name",
         "type": "string"
      }
   }
}